A few more debugging tips - run debugger automatically on linux
Posted 2023-03-13
Blog
Articles- arsd.pixmappresenter PR merged, stars and snow demo like the olden days, and update on me and D
- Browsers in D
- Minigui's mechanism is ok now, what about policy?
- Ephemeral web chat in 50 lines of D
- November 27, 2023
- arsd 11.3 coming soon, dpldocs search works again
- November 13, 2023
- D's selective imports have effects you may not want
- Dos and Don'ts in D
- Interpolated Expression Sequence PR opened
- version considered harmful
- di files are currently useless - the compiler does the same thing for the original source anyway
- arsd 11.2 - COM dispatch revamp
- arsd on Mac - solid progress
- September 18, 2023
- arsd 11.1 tagged, cgi.d performance, SerpentOS moves to Rust, trying out reggae
- DConf 2023 roundups
- dconf 2023 coming and arsd 11.1 progress - minigui tweaks, cgi hybrid new default mode on dub
- August 21, 2023
- August 14, 2023
- arsd 11.0 finally tagged
- arsd update - cgi listen to many
- July 24, 2023
- July 17, 2023
- July 10, 2023
- SAoC announced, my thoughts on potential projects
- June 26, 2023
- June 19, 2023
- June 12, 2023
- DConf deadline passes, write up on the -mv switch
- What is all this talk about IVY?
- May 22, 2023
- May 15, 2023
- My rpg finally releasing a demo this month?
- May 1, 2023
- April 24, 2023
- April 17, 2023
- Guis vs Games, why one library is unlikely to do both well
- Linux is better than BSD. Directory watchers and decompressors in arsd.
- Busy working this week
- arsd 11 progress report
- A few more debugging tips - run debugger automatically on linux
- March 6, 2023
- February 27, 2023
- Mike Parker hints D management changes coming, I write about static assert and platform porting
- Guest tip from Webfreak about toString
- Demo on custom sections
- A couple user programs announced, Adam writes more cgi.d docs
- On fullyQualifiedName
- Some thoughts on UI
- Moving toward arsd 11
- January 2, 2023
- More mixin tips to avoid stringof
- new textlayout class, dconf online thoughts, step by step tech progression
- Write barriers might not fix thread registration since you need to scan the stack
- Brief thought: D from Java/.net could be another write barrier benefit
- DIP DIP part 2: the user side
- new dmd, new DIP, beta dub docs, game lib announced. And politics in D
- dconf 2022 online schedule, some arsd.game work, template emission discussion with d index file proposal
- How NO_SCAN makes shorter GC pauses
- Write barriers could work
- simpledisplay custom font stream of thought
- Writing more arsd dox
- D on Arduino
- October 3, 2022
- September 26, 2022 - tip of the week to bypass IFTI
- September 19, 2022
- My thoughts on bitfields and recap of binary literals
- September 5, 2022
- preliminary design discussion of arsd.core event loop
- arsd 10.9 released
- Idea: user-extensible effect attributes
- DConf 2022 thoughts
- musings on pure websites
- static import object tricks
- Thoughts on inferred attributes
- I write on respect in discussions. D Vision document partial draft released.
- Exception idea: third Throwable branch. Probably won't work but written anyway.
- DIP DIP
- June 13, 2022
- June 6, 2022
- DConf 22 announced. arsd 11 not likely needed soon, 10.9 expected in another month
- May 23, 2022
- ImportC's module namespace problem
- Happy birthday, ImportC!
- Developers developers developers developers
- More dub 2.0 idea refinement
- Thoughts on async io
- April 11, 2022
- arsd bug fixes, stack overflow answer about X child windows
- dub 2.0 design discussion
- Tip of the week on justification comments
- March 14, 2022
- March 7, 2022
- February 28, 2022
- February 21, 2022
- dpldocs reindexing
- More rant on names
- Adam's thoughts on naming in code, tip from Steven about ufcs `i`
- Tip of the week: use mixin to hack around order-of-eval problems
- Tip: if code getting complicated, try rethinking the approach
- January 10, 2022
- arsd 10.5 coming this week, new midi code, a FF1 nsf player/editor application
- December 27, 2021
- my thoughts on std.socket design
- arsd work in progress updates and new "do it in D" idioms section
- December 6, 2021
- gdc sync going upstream, arsd 10.4 released, otherwise i was busy.
- working toward arsd 10.4
- DConf Online 2021 livestream
- arsd.webview work, public imports in adrdox changed
- importC released, preview of arsd web, database, gui updates, phobos2 coming, dual context tip of the week
- October 25, 2021
- My webasm updates, gdc in D
- Assorted quick thoughts
- October 4, 2021
- arsd 10.3, dmd -target, druntime.dll
- A potential GC puzzler discovered
- Rant: using Firefox is meaningless
- August 30, 2021
- Improving today's error handling
- Thoughts on error handling
- August 9, 2021
- August 2, 2021
- arsd.qrcode introduced and on my wish list: __arguments.
- July 19, 2021
- Drama on the github
- arsd 10.2 with http cookies support
- June 28, 2021
- arsd 10.1, thought on virtual functions, community announces light weight Druntime 0.3 among others
- arsd v10 tagged
- New dmd and ldc releases, ldc with druntime.dll!
- gdc 11 out with a lot of D updates
- May 24, 2021 general update
- Progress continues toward minigui 2.0
- C compiler in dmd? new string type in Phobos? brief update on my minigui overhaul
- Simpledisplay additions, minigui event changes
- April 26, 2021
- arsd 9.5 -- UPDATE: false alarm i forgot to tag it!
- April 12, 2021
- arsd 9.4 tagged, adrdox 2.5 released
- Tip of the week: using C libs from D
- working on gdc on Windows
- tip: use union to manually control struct member destructor
- Rant: people in the past weren't stupid
- Tip on DIY closures
- arsd 9.2
- Did you know about D anonymous classes?
- "Mental friction": my view on why D rox
- String interpolation DIP prototype
- terminal inline syntax highlighting, sdpy fonts improved
- January 18, 2021
- gdb debugging tips
- A little work on sdpy/terminal interop and apng debugging
- New plain tcp fiber socket class (with "how it works" docs), new arsd docs started, new dub subpackages in arsd. Also Turkish newsgroups added to forum.dlang.org
- Little audio player in D
- Thoughts on tutorial writing benefits, D marketing, and some simpledisplay.d improvements.
- arsd 9.0 rollup release, my thoughts on "google it" culture and related practices
- dpldocs.info cross-package search finally released! and more terminal getline enhancements
- I did a dconf livestream!
- New selective mouse input in terminal stack, Xft used in simpledisplay to improve TrueType font support
- simpleaudio now has playOgg, Mp3, Wav with resampling and can access multiple soundcards on Linux, adrdox gets ddoc on function params
- Weekend experiment: declarative GUI in D
- October 26, 2020
- My DConf livestream sneak preview
- Off topic jrpg video game review
- My thoughts on breakage, and I'll be in DConf Online 2020
- cgi.d hybrid server basically working, terminal.d can redirect stdout to a window if requested
- Some talk on cgi.d in benchmarks
- September 14, 2020
- New D update "dwidder" website launched, making-of post here
- white noise app in D
- More modern opengl in simpledisplay, document undocumented on dpldocs.info, tip on default template args
- Xlib taskbar in D
- D Tetris running on Webassembly
- Zero-runtime classes
- DConf online in the works for Nov 21-22, image copy/paste coming to sdpy soon
- July 13, 2020
- July 6, 2020
- simpledisplay getting dynamic loads, terminal gui gracefully degrades, i muse on scope raii classes
- Adam's dynamic link transition
- June 15, 2020
- June 8, 2020
- June 1, 2020
- foot pedal and midi fun, some dmd speed enhancements. Forum argues about @safe by default on extern.
- May 18, 2020
- simpleaudio dev work, rasp pi gpio module, static foreach rant, gcc 10's D support upped
- May 4, 2020
- my http more compatible with ssl, script+jsvar can do subclasses of D objects
- i want to make a jrpg, and have eye damage.
- Dustmite post on official blog
- What if I were dictator?
- March 30, 2020
- terminal.d with built-in emulator option releaed
- Online DConf in the works
- Dconf 2020 cancelled, Adam plays with terminal gui integration
- March 2, 2020
- some adrdox/dpldocsinfo updates
- terminal.d gets clipboard functions, ldc 1.20 out.
- DConf keynote speaker announced: Lua architect Roberto Ierusalimschy, Named args DIP discussed
- February 3, 2020
- Adam's terminal suite explained
- Understanding mixin templates, terminal.d improvements
- My attribute-by-default proposal. Also dmd 2.090 came out.
- DConf 2020 announced: June 17-20 in London. @safe by default debated. Adam did: Android, JNI, WebSocket in arsd libs
- tar.xz, --DRT tip, dom bug fixes, more Android and JNI, link to old phobos docs
- LDC 1.19 - Android, AVR. My rant on tests, update on JNI and COM.
- Walter's string interpolation proposal is OK but not great. My Android thing nearing beta release. dub downtime explained.
- Android project update, introduction to arsd.jni
- New pattern about interface contracts
- Adam shares Windows console secrets - DO NOT USE chcp!!
- Adam's rant on benchmarks
- Socket tutorial
- November 4, 2019
- October 28, 2019
- arsd package updates, forum nonsense
- Adam does iOS "goodbye world"
- September 30, 2019
- D turns 20, Adam rants on software freedom
- Named arg DIPs and my thoughts on code organization
- September 9, 2019
- I wrote about mixin templates vs string mixins on Stack Overflow
- August 26, 2019
- Bug bounty in D again - my hot take, on reusing code, a fun picture, my tentative plan for the next month
- Time invested is worth a lot
- cgi.d's new scheduler, static this tricks
- July 29, 2019
- July 22, 2019
- Solving vs managing problems
- A big week in the arsd repo
- June 24, 2019
- CRTP thoughts, named arguments DIP review, DConf videos now on youtube
- musings on hybrid CT/RT tests, some more progress on new web framework
- a little more webassembly
- May 20, 2019
- Adam's string interpolation proposal
- DMD 2.086 live, GCC 9 with D support formally released, DConf coming soon, links to posts on builder pattern and disallowing implicit conversions with templates, and 2d array op overloads
- template constraint error improvements coming?
- dmd 2.086 beta, dstep 1.0 released, Adam works on memory usage
- obj-c and webassembly report, tips on is expressions linked.
- new ldc, new dmd, dpp on the blog
- D's future discussed in forums
- LDC beta, DConf blog link, Adam introduces gamehelpers.d
- March 18, 2019
- LDC 1.15.0-beta1, responsive design rant
- dmd 2.085.0 released
- Obj-C interop and D without druntime code to copy/paste
- dmd beta, more info coming next time, demo of new web framework initial prototype
- automatic web interface discussion, reflection tips and tricks
- Adam busy with weather and a move, lots of community announcements
- January 28, 2019
- Working on official blog 2018 retro, C++ new wrapped, dmd reading zips?
- dmd obj-c growing, Adam static foreaches an interface to RPC
- IDE tools released, my cgi.d gets new features
- DConf announced, tip, Adam rants: mouse trap
- This Week in D is back!
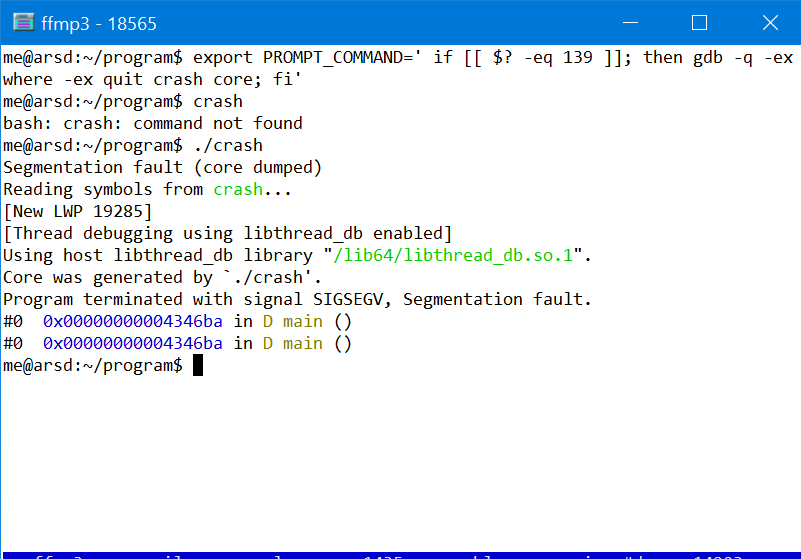
Some more things that might be helpful about using gdb on linux, especially for segfaults.